 SPATIAL INTELLIGENCE SPATIAL INTELLIGENCE
Mapping of Agricultural commodities and Infrastructure in the western Cape
Agricultural land use (in various scales and formats) is one of the most requested datasets from the Western Cape Department of Agriculture (WCDoA) GIS unit. Baseline commodity data and associated areas are required by decision makers at all levels and across many disciplines. At present we have little choice but to use data mainly derived from the National Land Cover (NLC) dataset, which was captured from LandSat satellite imagery by a consortium led by the CSIR, between 2000 and 2003 (NLC2000). The data was initially designed for broad scale use - i.e. around 1:250000. It does not identify actual land use (i.e. the actual commodity), but provides generalised categories of land cover - e.g. temporary cultivation, permanent cultivation, at a coarse scale. Most stakeholders nowadays require considerably more detail than this, for a wide variety of applications. Fine-scale data at farm or field scale is only available for a few areas where intensive surveys have taken place.
Examples of queries/tasks that need to be addressed by land use and associated data are: • Defining the actual, available hectares of agricultural land, and land lost to agriculture through mining, urbanisation and conservation.
- Rural development and land reform planning and analysis.
- Food security planning.
- Mapping the “footprint” of agriculture in terms of infrastructure, commodities and projects.
- Providing commodity statistics and/or maps to government and other stakeholders on, for example, areas under wheat, areas where persimmons are grown, total hectares under table grapes, etc.
- Providing regional production statistics to our own officials and economists - which can be aggregated and reported at any scale from farm, to municipality, to province.
- Departmental participation in and contribution to municipal and provincial spatial planning frameworks (SDFs).
- Providing data in support of the Department's Land Use Management officials in decisions regarding zoning/ rezoning applications, urban edge changes, developments, etc - it is critical to know what commodities and implied land values are affected.
- Disaster management - quick, quantifiable assessment of damage following floods, fires, and droughts. Having "inventory"-Level land use data facilitates calculation of the hectares and types of enterprises affected and associated economic impacts. Quantification of areas and commodities potentially at risk surrounding nuclear power developments.
- Identification of all irrigated land for planning purposes.
- Identification of land use per catchment for catchment management agencies, planning and hydrological modelling.
- Monitoring the trends in terms of land use changes and the associated losses of agricultural land.
- Support of conservation planning and Land care initiatives. Supporting the Department's mandated activities in natural and agricultural resource assessment and inventories.
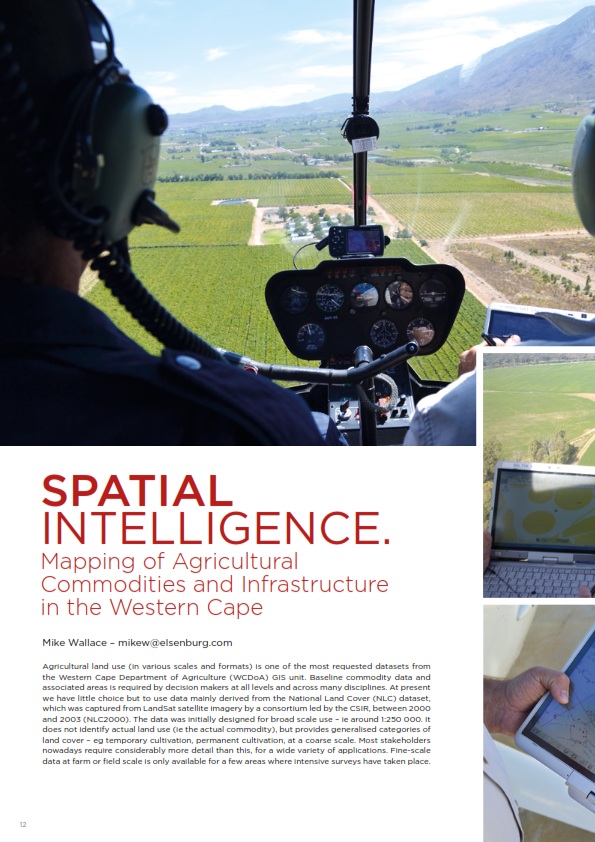
- Having field scale land use mapping that facilitates the "masking" of specific, similar land uses for remote sensing analysis and research, for example yield or biomass assessment using NDVI. There are likely to be a number of further transversal applications not listed here. In order to address these issues, the Department has taken the step of appointing an experienced consulting firm to conduct a field-scale aerial survey in order to simultaneously address a range of associated and urgent needs. The project is to address the needs of a wide range of Departmental stakeholders, so it becomes more of an agricultural inventory than a simple land use exercise. It is based on an "objective" survey, meaning that the surveyors generally do not contact farmers, but do most of the work by aerial survey using light aircraft and helicopters, with some remote sensing data used in the planning stages. The project will include aspects such as:
- A summer and a winter mission to map all agricultural commodities at field scale.
- A refinement of the existing farm spatial database.
- Comparison with existing statistics on agriculture in the province as provided by Statistics SA.
- An estimation of the hectares of current agricultural land and land lost to agriculture through mining, urbanisation and conservation.
- Define all irrigated land through air survey supported by remote sensing time-series analysis over five years archived NDVI data.
- Mapping of agricultural and agro-processing infrastructure such as: Pack houses
- Cool chain facilities
- Abattoirs
- Dairies
- Chicken batteries
- Tunnels
- Dip tanks
- Feedlots
- Agritourism facilities
- Map the status quo of land reform
Internally the data will furnish baseline data to a number of the Department's own information systems,(e.g. the Agricultural InformationManagementSystem,(AIMS)while the project will also address the needs of a wide range of stakeholders, not only in agriculture, but across other departments as well. The survey will provide a benchmark against which future changes (e.g. due to climate change, economics, land reform and urbanisation) can be measured, and should ideally be re-visited and updated every five years.
The project will also play a critical role in a forthcoming national project to define high potential and unique agricultural land, in order to protect it from development in accordance with new land use planning laws.
|